Data Science Methods as Applied to the Problem of Unchecked Peri-urbanization in Ho Chi Minh City
Word count: 1761
Introduction
Within the last 2 decades Vietnam, and more specifically Ho Chi Minh City, has received an increased amount of foreign direct investment [1]. This investment has incentivized the people of the area to urbanize in the city and its surrounding areas in order to benefit from the foriegn investment. Successful urbanization takes time, and as the Kuznets curve describes [2], it gets worse before it can get better. As a result, urbanization has led to a dangerous blend between rural and urban areas called peri-urbanization. Peri-urbanization brings with it the worst of both worlds, posing a threat to the Vietnamese people in health and economy. For this reason, I present the following central research: what negative impact has peri-urbanization as a result of the growing amount of Foriegn Direct Investment had on the citizens of Ho Chi Minh City, and how can we visually model those impacts on a monthly basis using remote sensing and statistical techniques?
This central research question is accompanied by three critical sub-research questions which attempt to support and answer the broader inquiry. Those three sub-research questions are as follows: what impact has land use, elevation, soil type, and ground material characteristic of peri-urbanization had on the likelihood of flooding in the Ho Chi Minh City area? What impact has lackluster infrastructure in peri-urban areas had on the likelihood of avian influenza transmission in humans and poultry in the Ho Chi Minh City area? What are the expected monetary impacts of flooding on business and avian influenza on poultry sales, and how has this exacerbated hardships on the Ho Chi Minh City area people? The collection of the central research question and its accompanied sub-research questions is characterized as an explanatory inquiry as it attempts to understand the relationship between multiple variables, understanding the underlying cause and effects relationship between them.
Two Data Science Methods
In order to answer the central research question and its sub-questions, data science techniques must be applied to the gathered data. In the case of this problem, it is important to have methods of classification in order to break satellite data into understandable and defined regions. Two important classification methods critical to answering the central research question are the Chi-square Automatic Interaction Detector (CHAID) and Support Vector Machine (SVM) Classifier.
Both methods make use of satellite imagery. Example sources of applicable data include SAR and Landsat images. Satellite data have both a temporal and spatial dimension, as the data are collected over a period of time and show the spatial relations between critical areas. The data are validated by on-site surveying and other methods including cross-analysis with Google Maps. These data are analyzed using each method in order to then classify the relationship between the various categories.
A CHAID Tree uses a Chi-square analysis and equation to find relationships and patterns between two or more variables. This analysis is visualized using a logic tree where each branch represents a statistically significant difference between two variables. The branching continues until there are no more statistically significant differences between the observed variables [3].
The Chi-square test results in a p-value ranging from 0 to 1, where values closer to 0 are more statistically significant and values closer to 1 are less significant. The alpha value is a set number that denotes statistical significance when the p-value is less than it. The alpha value differs from test to test, with the conventional alpha value being a p-value of .05. In order to avoid Type 1 error in identifying a false positive, the Bonferroni Adjustment is applied to shift the alpha value, the required p-value to declare statistical significance, so that the probability of Type 1 error does not rise. The Bonferroni Adjustment is where the initial alpha value is divided by the number of tests, meaning the alpha value needed to be statistically significant shrinks at higher numbers of tests. As a result, the criteria to be statistically significant is stricter down the tree [4].
In relation to the central research question, New Modeling Approach for Spatial Prediction of Flash Flood with Biogeography Optimized CHAID Tree Ensemble and Remote Sensing Data [5] uses the CHAID Tree categorical method. They outline their equation as such:

The X2 denotes the chi-square value, nij is the frequency of observed cells, and mij is the mean of frequency of the observed cells. The nij is subtracted by the mean, with the outcome squared to account for sign changes. That is then divided by the mean to get the standard deviation. This process is repeated for all cells and then added together to get the chi-square value. This chi-square value can determine a p-value based on the degrees of freedom and charts.
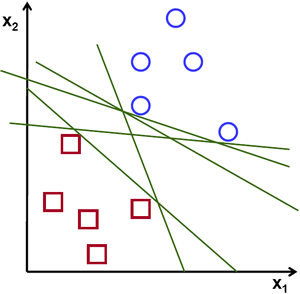
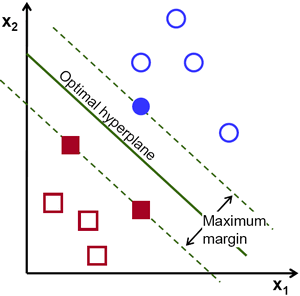
A Support Vector Machine Classifier is a similar method in order to distinguish categorical differences in the data. This method takes two or more clusters of data and attempts to create a hyperplane that goes in between the groups. It cannot be any line, but rather must be a hyperplane that goes through the middle of the two groups and has the highest margin between the nearest data points. This means that the hyperplane is equidistant from the data points on both sides and it is positioned such that this distance is maximized. In the case of 2 data sets, the hyperplane is a line. With 3 data sets it is a plane. The name of the support vector comes from the data points which are closest to the hyperplane. They are called support vectors because they determine where the hyperplane lays and support that line [6]. An example hyperplane produced by a support vector machine is as follows [6]:


The hyperplane is an equation that has the intended purpose of presenting an answer that is either greater than or equal to 1 or is less than or equal to -1. This is where the distinction between classes comes into play. Those numbers greater than or equal to 1 are determined to be of one classification, and the converse is true for -1[6].
The support vector machine uses more than just one simple equation. It starts with 3 simple equations or truths, and makes a more complicated development from there. The equations follow the simple formula of y=mx+b since they are producing a line. The first equation is w^TX+b=0 and is applicable to all points on the graph. The second equation is w^TX+b=1 for all points in the positive classification. The third equation is w^TX+b=-1 for all points in the negative classification. The margin of the hyperplane is denoted as n=2/w where the margin is maximized when w is minimized. In each of these equations w represents the weight vector that is normal to the hyperplane, X represents the positive or negative support vector, b represents a constant, and n represents the unit-length support vector.
The two presented methods are complementary in nature. Both attempt to give classifications to data sets so that they can be further analyzed. The CHAID method is more visual in nature due to the tree diagram while the support vector machine classifier gives a raw number, however, the hyperplane of the SVM can provide a visual when graphed alongside the data. Neither method is an upgrade over the other, but rather a method to be used in tandem.
Results
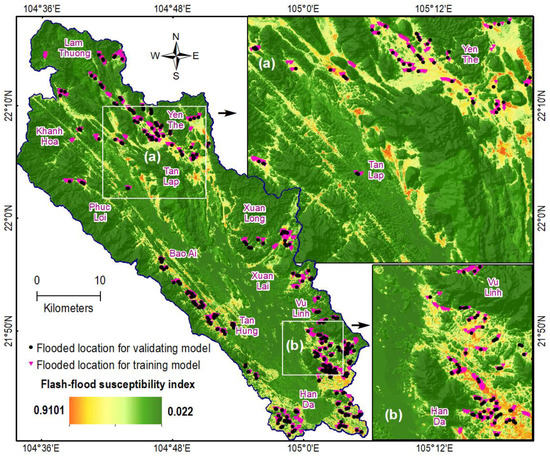
The Chi-square Automatic Interaction Detector used in New Modeling Approach for Spatial Prediction of Flash Flood with Biogeography Optimized CHAID Tree Ensemble and Remote Sensing Data[5] provided critical findings. Most notably, it was able to understand the relationship between 7 distinct variables; river density, rainfall, elevation, topographic position index, slope, aspect, and curvature. The method produced a series of branches which represented statistically significant differences between each variable.
The method and study were able to find a .65 positive correlation between the Land Use Land Cover and slope factors, as well as a -.57 correlation between the topographic position index and slope factors. In addition, method and results produced a critical understanding of flooding susceptibility in the area. The results indicated the highest level of flash flood susceptibility within mountainous highland areas, as well that these flash floods were most likely to occur in storm season. Conversely, it illustrated that the lowest rate of flash flooding was in the lowland. These results prove to be predictive since it shows an increase in likelihood of flash flooding in one area over another. The method resulted in the following image:

Comprehensively, the Chi-square Automatic Interaction Detector method was helpful in answering the proposed question by giving a quantitative understanding of the data. The method was capable of illustrating statistically significant differences between each variable. This gave the researchers a clear, quantitative relationship between each of the observed features and variables, guiding the inquiry and illustrating critical trends.
Similarly, the Support Vector Machine Classifier in Monitoring Peri-Urbanization in the Greater Ho Chi Minh City Metropolitan Area[1] provided important understanding of the issue at hand. More notably, the SVM was applied to the Landsat imagery so that it could then be classified to be put into ENVI software. Combined, researchers began to understand the quantitative change of land use over a prolonged period of time. This enabled them to understand the trends of the area.
The method and study resulted in findings indicating that 660.2 km2 of cropland had been converted to built up areas. As well, it showed that more than 62% of the new urbanization was characterized as peri-urbanization. The SVM method allowed the researchers to produce the following bar graph, representing the overwhelming increase in peri-urban sprawl:

These findings provide a better understanding of the growing urbanization and peri-urbanization spread. It indicates a concerning trend when coupled with additional resources that document the perils of peri-urban spread and how it negatively affects the people.
Further Gap in the Literature
Though these results, methods, and studies show a clear trend, they do not address the totality of the question. Most glaringly, the presented material does not show the direct economic impact of peri-urbanization. In addition, the two studies fail to analyze the critical spread of avian influenza in the Ho Chi Minh City area. These gaps are not a failure of the methods, as each have universal application, but rather the direction of the studies. For this reason, both would have a beneficial impact on an independent inquiry, providing the needed classification of areas as well identifying potential risk factors in the context of disease spread for Ho Chi Minh city and its surrounding area.
Refrences
-
Kontgis, C., Schneider, A., Fox, J., Saksena, S., Spencer, J., & Castrence, M. (2014, July 30). Monitoring peri-urbanization in the greater Ho Chi Minh City metropolitan area. Retrieved October 11, 2020, from https://www.sciencedirect.com/science/article/pii/S0143622814001477
-
Spencer, J., Finucane, M., Fox, J., Saksena, S., & Sultana, N. (2019, October 14). Emerging infectious disease, the household built environment characteristics, and urban planning: Evidence on avian influenza in Vietnam. Retrieved October 11, 2020, from https://www.sciencedirect.com/science/article/pii/S0169204619313465
-
Littler, S. (2018, May 31). CHAID (Chi-square Automatic Interaction Detector). Retrieved November 01, 2020, from https://select-statistics.co.uk/blog/chaid-chi-square-automatic-interaction-detector/
-
Ramzai, J. (2020, June 20). Simple guide for Top 2 types of Decision Trees- CHAID & CART. Retrieved November 01, 2020, from https://towardsdatascience.com/clearly-explained-top-2-types-of-decision-trees-chaid-cart-8695e441e73e
-
Citation: Nguyen, V., Yariyan, P., Amiri, M., Dang Tran, A., Pham, T., Do, M., . . . Tien Bui, D. (2020, April 26). A New Modeling Approach for Spatial Prediction of Flash Flood with Biogeography Optimized CHAID Tree Ensemble and Remote Sensing Data. Retrieved October 11, 2020, from https://www.mdpi.com/2072-4292/12/9/1373/htm
-
Gandhi, R. (2018, July 05). Support Vector Machine - Introduction to Machine Learning Algorithms. Retrieved November 02, 2020, from https://towardsdatascience.com/support-vector-machine-introduction-to-machine-learning-algorithms-934a444fca47